


Jul 178 min read


May 191 min read


Apr 36 min read
Updated: May 8, 2025
Tariff fears have subsided, and the probabilities are incredibly high that the market has seen the lows for this cycle.

The stock market mini-crash following Trump's tariff announcements has been making very positive steps towards recovery.
Markets have not rallied all the way back to all-time highs yet.
But the S&P 500 has rallied to overcome a major hurdle, potentially opening the way for all-time highs to occur.
While volatility may not be completely over just yet, the market just completed a V-recovery of the crash phase of the recent decline.
The S&P 500 index is showing a textbook V-shape recovery thus far.
We'll say it again...it doesn't mean volatility is over.
However, it does suggests that the lows from April 7th, when the S&P 500 bottomed around 4800, should be the lows for the year.

The market has made incredible strides the past few weeks, and the majority of historical data points suggest that the lows from early April should not be retested.
Some back-filling over the coming weeks and months would be perfectly normal, but if that happens it should occur with less panic and lower volatility spikes.
More evidence that markets have bottomed is the crash in the VIX.
Fortunately, a VIX crash is bullish.
Let's look at the VIX chart next.

Once Trump announced the tariffs, volatility exploded higher, going from a normal 24 to a panic 60 in just a few days.
After that spike, the VIX then had the second largest decline over a 4-week span in its history.
A good crash.
Returns for stocks were excellent after a decline in the VIX this large, as shown in the next chart below from Charlie Bilello.

The average returns after the largest VIX collapses are strong. After six months the average return is 8.4%, and after 12 months is 16.8%. Not bad.
And it compliments the other data that shows good returns after volatility like we've seen recently.
In the recent pullback, markets declined almost exactly 20%.
What happens after markets decline 20%?
The following chart, courtesy of Fidelity Investments, shows market performance after 14 separate 20% drawdowns.

What is interesting to see is that there were only two times that the market was lower 12 months out.
Every other instance showed positive returns over the next year.
Consider this another ball in the "worst is behind us" bucket.
One trend in financial markets is that prices are moving more quickly than in previous years and decades.
Two things are responsible for that, in our opinion:
Communication and Trading Technology - Information spreads incredibly fast and people act on emotion first and logic second.
The Media is Broken - Remember, they are selling commercials, not trying to inform you.
Technology increasing the speed of information and trading is relatively easy to comprehend.
But the media is taking the playbook of fear and anxiety to another level.
Case in point...view the image below of the weather segment of a normal news program in Germany.
The top section was in 2017.
The bottom section is from 2022.
Notice anything different?
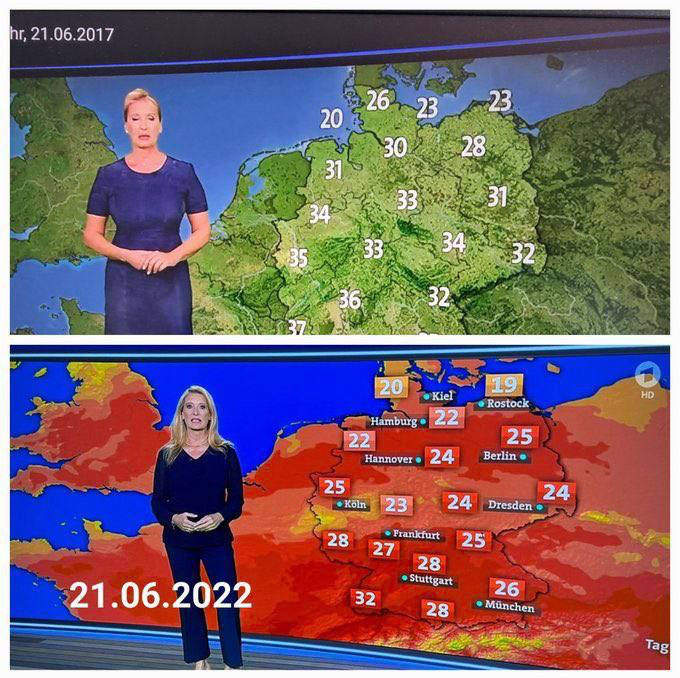
The only reason to make this obvious of a shift towards intentional anxiety creation is to create uncertainty and fear. This type of subliminal programming infects our psyche, and television executives (and politicians) know it.
No wonder ratings are in the dumps.
Love him or hate him, Trump has been vilified by the media for at least a decade.
This intensified the selloff.
Stock crashes like what we've seen are not based on economic data.
Crashes are emotional.
Crashes are panic disguised as proactiveness.
That's why we have been looking at the technical data, especially sentiment indicators like the VIX, advance/decline lines and data on flow in and out of various assets.
Every single stock crash is rooted in uncertainty.
Major bear markets, like the 2000 tech bubble and 2008 financial crisis, are rooted in underlying problems within parts of the financial system or economy.
Crashes not so much.
People extrapolate their personal belief system on the environment around them, markets included.
So having a bad impression of Trump carries over to having a bad impression on his policies. Or at least looking at them with skepticism and pessimism.
It happened with Biden and Obama as well.
Anger and uncertainty at Trump carried over to anger and uncertainty of his policies.
The fact is, no one knows where the tariffs will end up, or whether they will ultimately be positive or negative.
Will it cause a global recession? Possibly.
Does it signal going further down the road of deglobalization? Absolutely.
Does it mean that the market will crash further? Probably not.
At this point, there is really no reason to assume tariffs will have a negative effect, although they definitely could.
What we can assume is that we should expect uncertainty to decline as the financial world adjusts to the United States' new approach to tariffs.
The majority of indicators we follow are showing bullish data.
But that doesn't mean the market can't decline further.
We view the next month as incredibly important. Markets have recovered the mini-crash nicely, and now they need to hold various support levels.
The next chart shows our view on what levels to watch.

We have identified three zones for you to keep an eye on:
Above 5500 (green): Bullish
5100-5500 (tan): Neutral, but bearish scenarios increase in likelihood
Below 5100 (red): Bearish
The initial "line in the sand" is 5500. If markets can stay above that level, the bulls will remain in control and will likely try to push markets to new highs.
Below 5100 opens up all sorts of bad scenarios, and below 4800 confirms a major bear.
In between 5100 and 5500, the market is likely confusing and choppy. In this range is where bearish scenarios start to increase in probabilities.
It still feels very uncertain.
That is normal.
The feeling will probably linger for a few more months.
There is a saying that markets climb a "wall of worry". This is what that feels like.
Markets have calmed down substantially, despite there being no real progress on tariff agreements.
That's because the volatility was not about the economic and political effects of tariffs. It was always about the fear and uncertainty of an unknown and unanticipated development globally.
Over the next few months, don't be surprised by renewed bouts of volatility. That is a normal part of the process after a mini-crash.
But we would be surprised if we see the S&P 500 trade back to the April low at 4800.
Invest wisely!